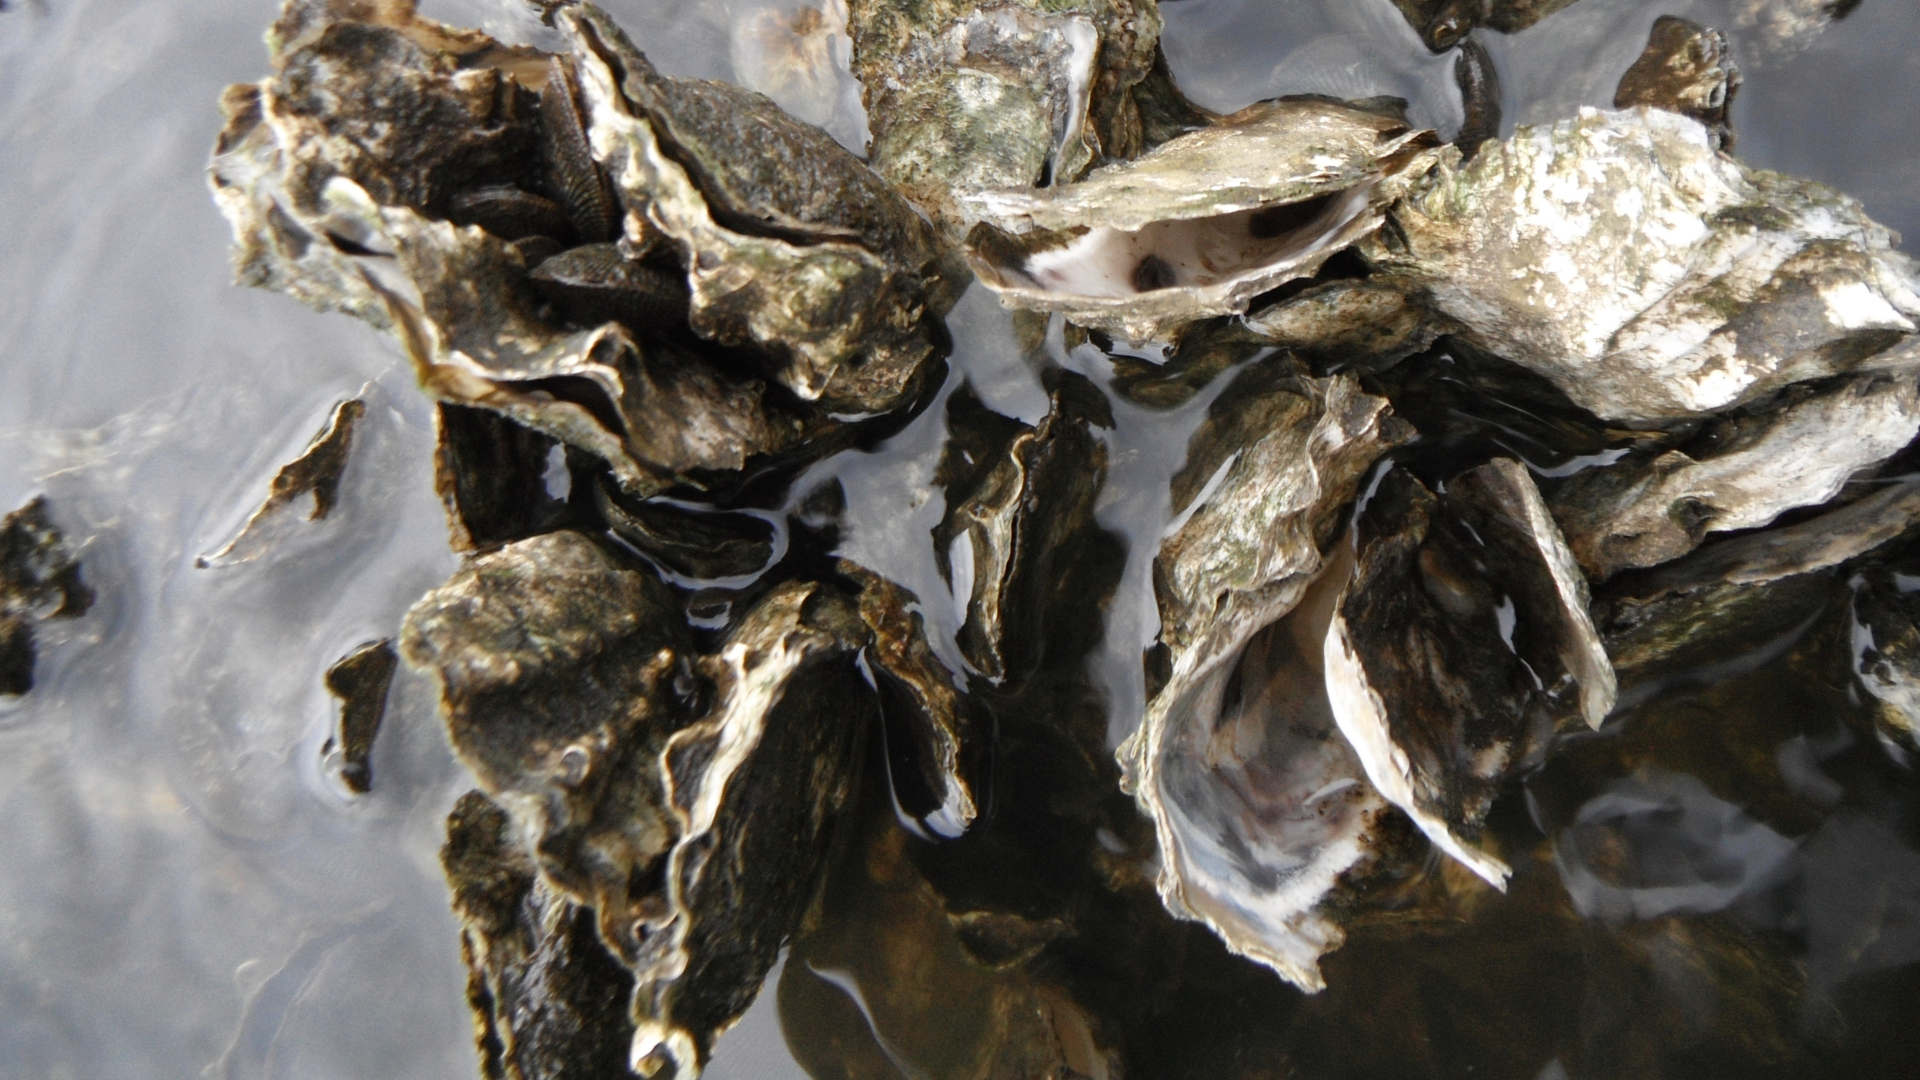
At Florida Oceanographic Society, our Florida Oceanographic Oyster Restoration (FLOOR) program keeps a close watch on the health of oyster reefs in the Indian River Lagoon and St. Lucie Estuary. These reefs—both natural and man-made—are home to thousands of oysters that help keep our waterways clean and full of life.
Each month, our team studies how oysters are doing by measuring how many new oysters (spat) settle on reefs, how fast they grow, and how well they survive. This helps us learn how healthy the oysters—and the entire estuary—really are.
To do this, we hang pairs of clean oyster shells (collected from local restaurants!) from special PVC T-bars in the water. These shells float at the same level as live oyster reefs. When conditions are good, tiny baby oysters attach to the shells and begin to grow.
Every month, we bring the shells back to our lab to count the new spat. Twice a year, we take a closer look at a few shells to study how healthy the oysters are.
All of this data helps us track changes in water quality, measure the success of our oyster restoration projects, and protect these amazing filter feeders that keep our estuaries thriving.
By studying oysters, we’re not just learning about one species—we’re helping care for the entire coastal ecosystem.

Newly settled spat on an oyster shell.

Oyster biomass

Oyster gametes under the microscope

